Server & Cloud
2026 Cloud Hosting & VPS Performance Report
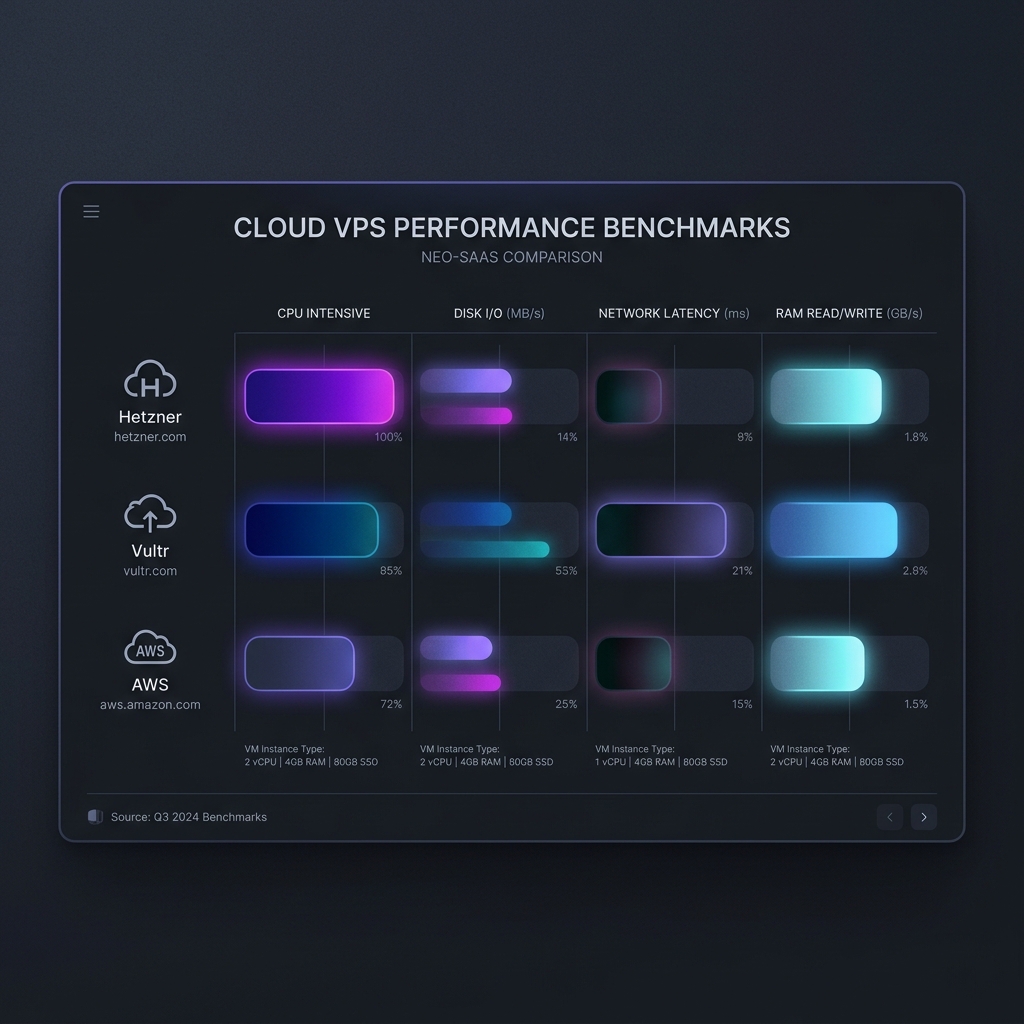
Single-thread vCPU, NVMe disk IOPS, and network latency benchmarks.
12 min read
Read →
Stop relying on marketing claims. We stress-test single-core vCPU throughput, NVMe SSD random IOPS, TTFB response latency, and Node vs Python runtime concurrency.
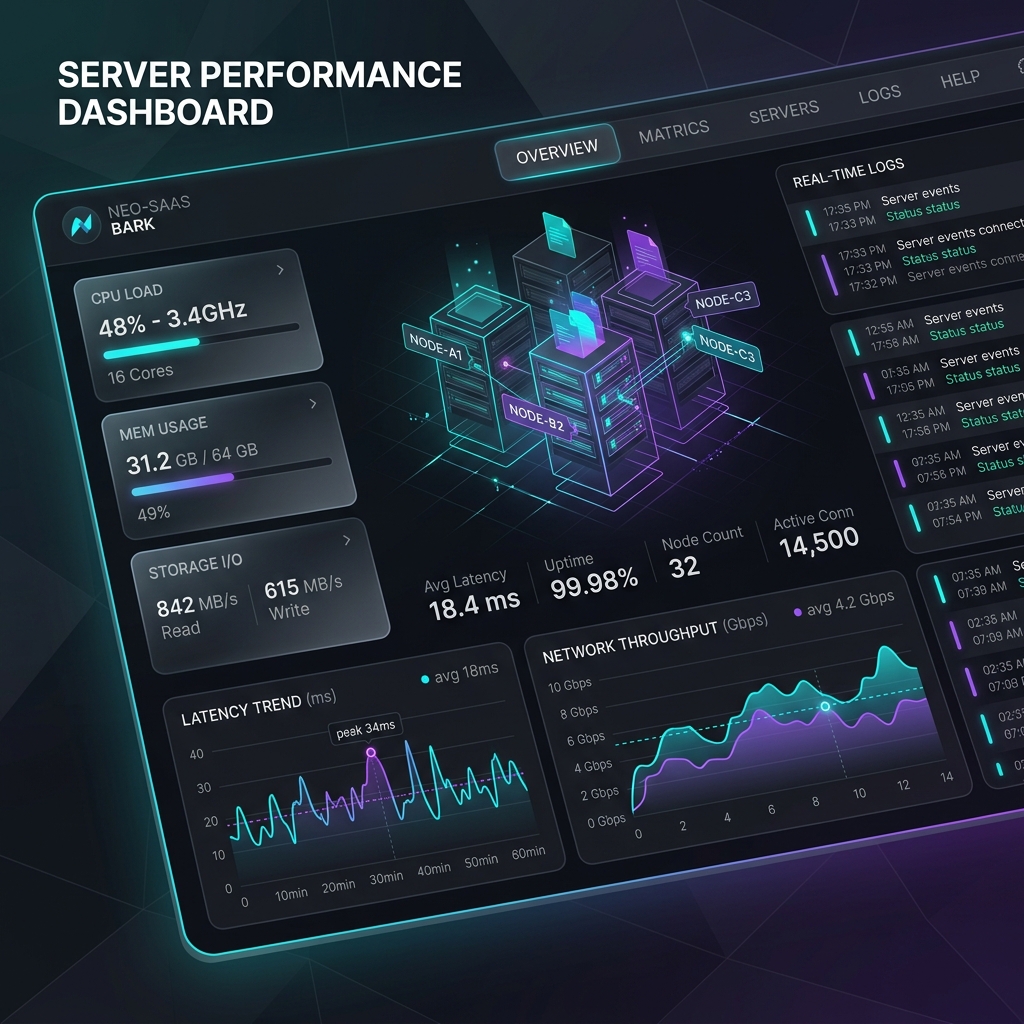
Search, filter, and compare real-world telemetry metrics across top cloud hosting infrastructure.
| Provider & Plan | Category | vCPU & RAM | NVMe IOPS | TTFB Latency | Price | Score | Affiliate Deal |
|---|---|---|---|---|---|---|---|
|
HZ
Hetzner Cloud CPX21
#1
Value Award
|
Cloud VPS | 3 vCPU / 4GB RAM | 145,000 IOPS | 24 ms | $7.49 / mo | 98 | Get €20 Credit 🚀 |
|
VL
Vultr High Frequency
Fastest
CPU
|
Cloud VPS | 2 vCPU 3.7GHz / 4GB | 160,000 IOPS | 18 ms | $12.00 / mo | 96 | Claim $100 Free 🚀 |
|
DO
DigitalOcean Premium AMD
|
Cloud VPS | 2 vCPU / 4GB RAM | 120,000 IOPS | 22 ms | $14.00 / mo | 94 | Claim $200 Credit 🚀 |
|
LN
Linode / Akamai Premium
|
Cloud VPS | 2 vCPU / 4GB RAM | 115,000 IOPS | 26 ms | $12.00 / mo | 92 | Get $100 Free 🚀 |
3 vCPU AMD EPYC / 4GB RAM / 145k NVMe IOPS
Drag the slider to calculate TTFB speed impact on Google Core Web Vitals (LCP).
Standard Google target TTFB is 120ms. High server response times degrade mobile SEO rankings.
Single-thread vCPU, NVMe disk IOPS, and network latency benchmarks.
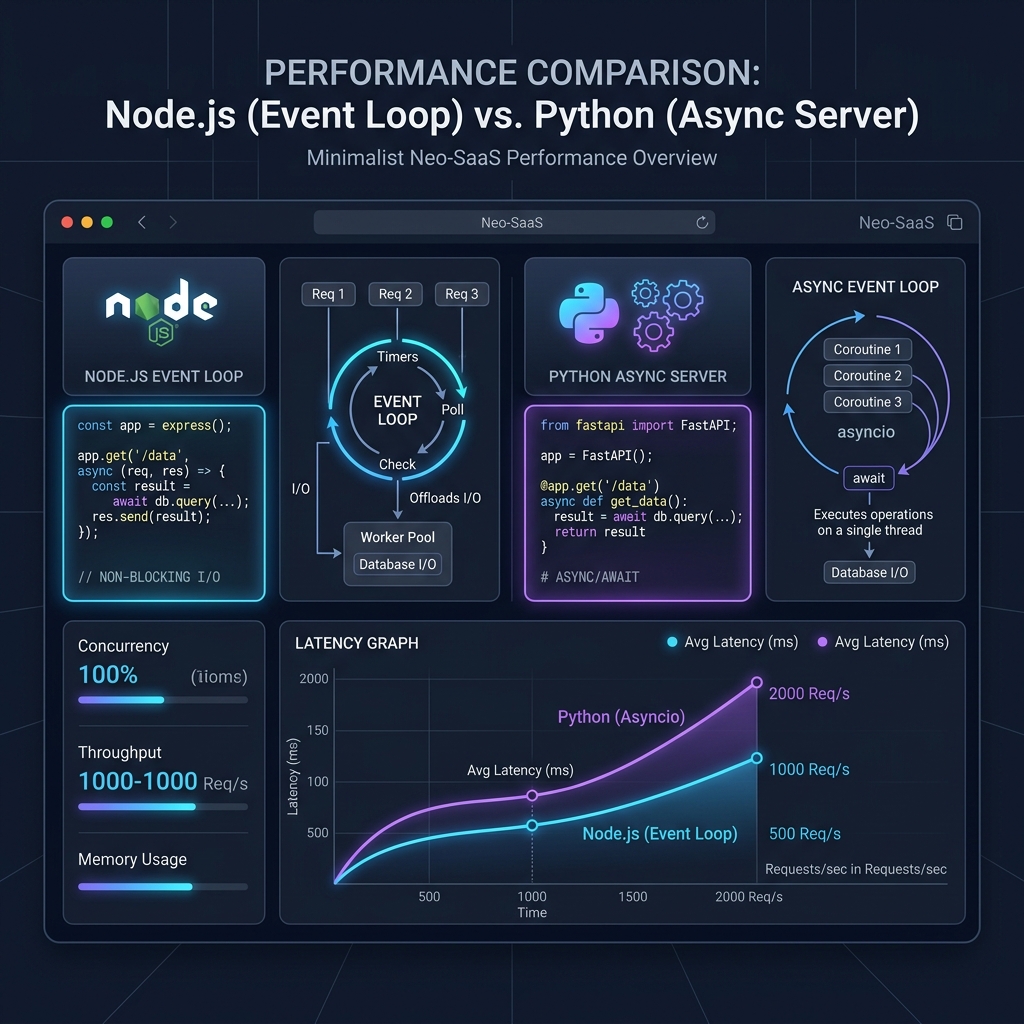
V8 event loop vs FastAPI/Gunicorn under 10,000 active requests.
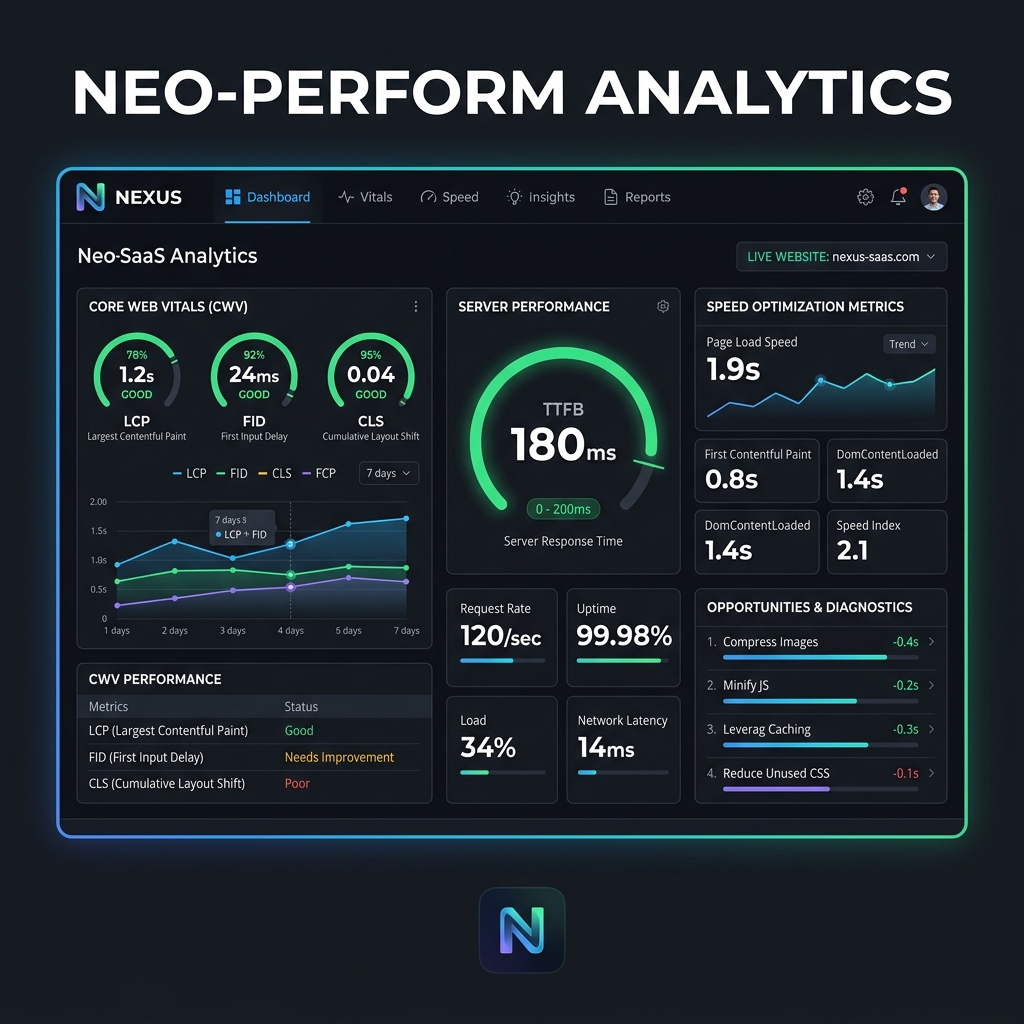
How server TTFB latency penalties degrade LCP rankings.

Price-to-performance breakdown of cloud slicing vs raw bare metal.