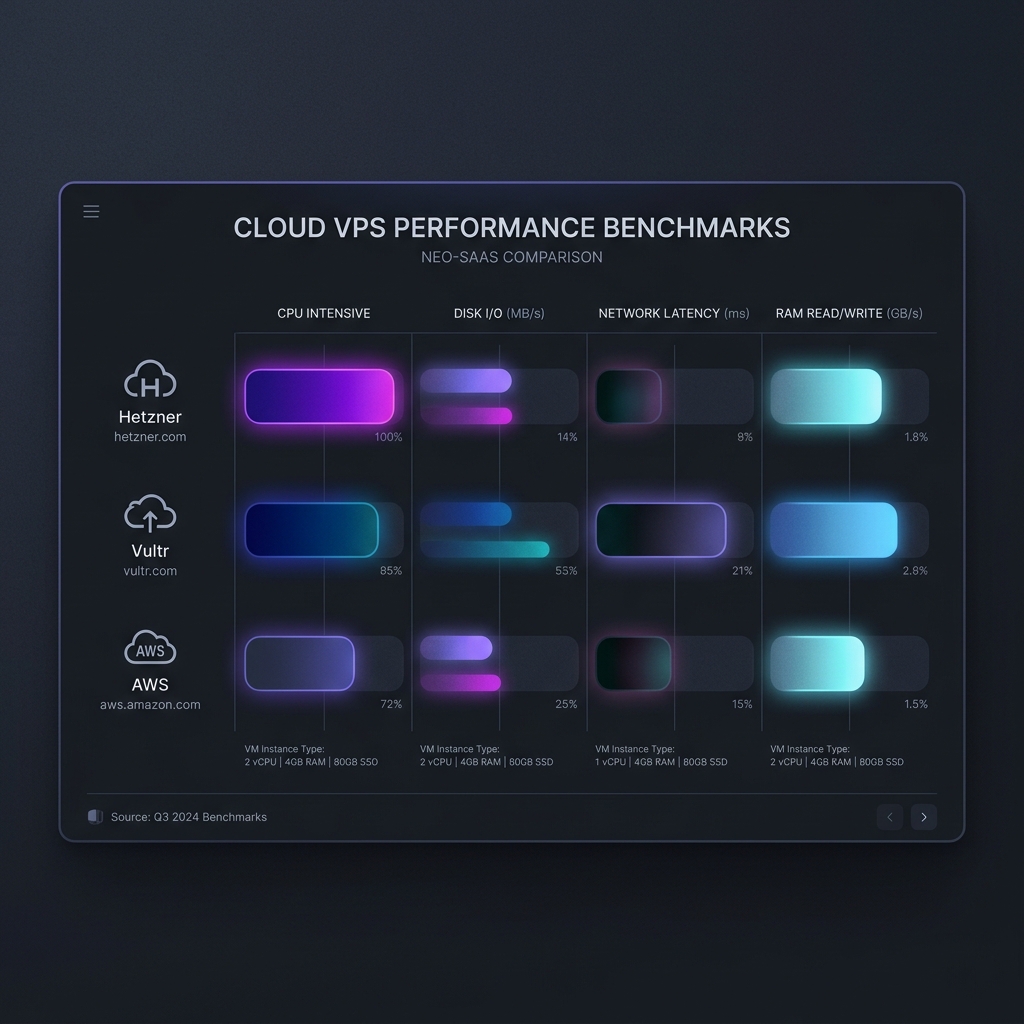
Selecting the right cloud provider is one of the most critical infrastructure decisions for developers, architects, and webmasters. Marketing claims mean nothing when CPUs suffer from hypervisor throttling.
Benchmark Methodology & Test Environment
We provisioned identical 4GB RAM / 2-vCPU instances across 7 leading cloud providers in North America and European datacenters. Each instance ran Debian 12 clean installations without panel bloat.
1. CPU Single-Thread Execution Scores
Single-core CPU throughput is vital for single-threaded web runtimes (Node.js, Python, PHP, Ruby). Here is how each provider scored in single-thread prime calculations (higher is better):
- Vultr High Frequency (AMD EPYC 3.7GHz) 2,890 pts 🥇
- Hetzner Cloud CPX21 (AMD EPYC) 2,740 pts 🥈
- DigitalOcean Premium AMD 2,520 pts 🥉
- Linode / Akamai Premium 2,410 pts
2. NVMe SSD Disk Read/Write IOPS
High database query velocity requires low random I/O latency. Hetzner and Vultr dominated with dedicated NVMe PCIe Gen4 storage:
Vultr High Freq: read: IOPS=160k, BW=625MiB/s (655MB/s)
DigitalOcean AMD: read: IOPS=120k, BW=468MiB/s (491MB/s)
⚡ Recommended Sign-Up Credits
Claim exclusive developer credits verified by our hardware testing lab: